- Рубрики
- Філософія, психологія, педагогіка
- Історія
- Політика, право
- Економіка
- Математика
- Фізика
- Хімія, хімічна технологія
- Біологія, валеологія
- Геодезія, картографія
- Загальнотехнічні науки
- ІТ, комп'ютери
- Автоматика, радіоелектроніка, телекомунікації
- Електроенергетика, електромеханіка
- Приладо-, машинобудування, транспорт
- Будівництво
- Архітектура, містобудування
- Мовознавство
- Художня література
- Мистецтвознавство
- Словники, енциклопедії, довідники
- Журнал "Львівська політехніка"
- Збірники тестових завдань
- Книжкові видання
- Наукова періодика
- Фірмова продукція


№ 85 (2017)
UDC 528.92
B. CHETVERIKOV1*, K. BONDAR2, R. HOMENKO2, S. DІDENKO3, M. SHEYHET4
1 Department of Photogrammetry and Geoinformatics, Lviv Polytechnic National University, S. 12, Bandera str., Lviv, Ukraine, 79013, +38(063)1671585, e-mail chetverikov@email.ua
2 ESI of “Institute of Geology”, Taras Shevchenko National University of Kyiv, 90, Vasylkivska str., Kyiv, Ukraine, 03022, tel. +38 (044) 5213338, e-mail: ks_bondar@ukr.net
3 National Museum of History of Ukraine, 2, Volodymyrs’ka str., Kyiv, Ukraine, 02000, +38 (044) 2784864, e-mail: svdidenko@yandex.ru
4 Union of councils of Jewish in the former Soviet Union, 27-1, Fedorova str., Lviv, Ukraine, 79054, Tel. +38 (067) 6700902,
e-mail: meylach@gmail.com
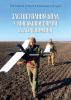
DETERMINATION OF LOCATION OF THE HISTORICAL OBJECTS USING PHOTOGRAMMETRIC METHODS AND METHODS OF NON-DESTRUCTIVE GROUND RESEARCH
https://doi.org/10.23939/istcgcap2017.01.094
Aim of this work is to establish and display the territory of the mass graves at the Raylivka village on modern maps using the archive data. To define the place of mass executions and burials during the World War II using interpretational properties of the archival aerial images obtained by the Germans in 1944 and ground geophysical researches. Methods. There is proposed the method of determining the locations of mass graves by World War II that combines remote methods (interpretation of images) and ground non-destructive methods (geophysical research). Photogrammetric processing of archival aerial images in 1944 was divided into the following three stages: transformation of the used materials to one coordinate system (in the case of archival aerial images transformation was performed by reference points that were preserved); and overlaying of the images on this territory at different times to determine the true boundaries of burial; and finally preparation of the final data. At the first stage archived aerial image and modern space images were registered using software ErdasImagine with errors up to 3 meters were stored in a format GeoTIF. Then there was implemented the interpretation of archival aerial images and transfer of defined boundaries of mass graves into the current situation. The final stage of this method is the generation of the resulting research materials. Input data of the geophysical research was the data that were obtained by the photogrammetric method. During the field works the following studies were carried out: a magnetic survey; research by TER; georadar, and soil research. As a result of studies a large number of artifacts from World War II were found and the boundaries of mass graves defined by photogrammetric method were substantially confirmed. Results. The places of mass executions and burials of the World War II were preliminarily determined based on the interpretation of archival aerial images obtained in 1944. With ground geophysical studies confirmed the fact of mass executions in the experimental area on the base of discovered casings from German arms. Also confirmed by photogrammetric identification method was the location of the mass graves. Scientific novelty. The proposed method that combines the remote photogrammetric and ground geophysical research determination of mass graves of World War II allows reliably and with reasonable accuracy determining its territory on modern maps. The practical significance. Developed cartographic materials and researching results can be used to display historical events that occurred in the area. The results of this work can be transferred to the Department of preservation of cultural heritage of Lviv as the annex to the passport of cultural heritage object.
Key words: archival aerial image; remote sensing data; geophysical researches; ground penetrating radar; photogrammetric researches; mass graves.
Література – 14.
УДК 528.854
V. MENDEL
Chair of Geodesy, land development and cadastre, Lesya Ukrainka Eastern European National University, 13, Voli av., Lutsk, Ukraine, 43025, tel.: 097-702-31-92, е-mail: mendel-vadim@ukr.net
APPLICATION OF MATHEMATICAL MORPHOLOGY METHODS
IN TERMS OF EROSIVE PROCESSES RESEARCH USING AERIAL
PHOTOGRAPHY MATERIALS
https://doi.org/10.23939/istcgcap2017.01.076
Object of study. Planned distribution establishment of erosive “spots” of the agricultural lands is based on the processing of binary images of aerial photographic materials using morphological and planimetric methods of analysis. Methodology. Offered methodology is based on the non-linear operators’ application. These operators are mathematically described by the theoretical and set formalism. Mathematical morphology uses two main morphological filters which can be represented as a successive combination of two stages of image analysis on the basis of the morphological operators using: constriction and extending. Results. For obtaining maximal image characteristics it was suggested to carry out processing in the following sequence: binarization, segmentation, and morphological and planimetric definitions. Binarization content is characterized by bright spots, which show the release of soil-forming rocks to the surface, which can be divided by well-known method of prof. V. M. Sokolova (with sequential split pixels). The above-mentioned process is mostly used in digital photogrammetry. The corresponding mathematical apparatus is represented. The next stage of binary image processing is the allocation of adjacent boundaries and sites by the Laplace’s method of segmentation. In such a case, an estimation of two different contrast areas A and B is conducted. To determine the boundaries of their division, the marks of the contrast ratio’s second derivative are estimated. It is offered to carry out segmentation according to graph theory. An illustration of this segmentation is represented graphically. At the third stage of the study, morphological and planimetric determinations were performed on the investigated image using 2 × 2 pixel masks. As a result, it is possible to calculate statistical distributions of spots on aerial photographs by area, perimeter, and factor form. Scientific novelty. The offered method of step-by-step processing of aerial photography is based on the use of binary and segmentation methods which allow acquiring a precise image and more accurate results of morphological and planimetric definitions. Practical significance. According to the above-mentioned algorithm, some morphometric characteristics of spots on aerial photographs were analyzed: area, perimeter, and form factor. Application examples which confirm the universality of the suggested method for analyzing images in a microphotogrammetry are given in the work [Melnyk, 2013].
Key words: aerial photography, segmentation, pixel mask, binarization, erosion, morphological filters.
Література – 26.
UDC 528.3
K. BURAK¹, B. LYSKO²
¹ Department of Engineering Geodesy, Ivano-Frankivsk National Technical University of Oil and Gas, 15, Karpatska str., Ivano-Frankivsk, Ukraine, 76019, e-mail: burak.cost@yandex.ua
² Department of Engineering Geodesy, Ivano-Frankivsk National Technical University of Oil and Gas, 15, Karpatska str., Ivano-Frankivsk, Ukraine, 76019, e-mail: 93lisko@gmail.com
EXPLORING THE ACCURACY OF LENGTHS CONSTRUCTIONS WHEN SOLVING THE ENGINEERING GEODESY ISSUES WITH RTN METHOD
https://doi.org/10.23939/istcgcap2017.01.005
Purpose: This study assumed: experimental determination of the accuracy of measuring relatively short distances, typical for performing survey, planning and marking engineering geodesy works using a dual frequency GNSS receiver under different conditions of observation, and using RTN-technology on mountain area of the Precarpathian region. Methodology: To investigate the accuracy of measuring short distances, seven experiments that differed in mutual position of permanent stations and physical geographical conditions of outside conditions were performed. To minimize the sporadic errors and increase the accuracy of obtained results, the investigation in the city of Ivano-Frankivsk was made on the inherent basis, which allows the forced centering of tools. The special aspect of this basis is that it is situated very close to the permanent station (10 km). Observations were made in RTN-mode with the receiver accepting differential alterations from the System Solutions network. Results: Results of the study are: obtainment of range accuracy depending on mutual positions of System NET network points; based on testing of the hypothesis about equality of general dispersions of two normally distributed groups, that are receiving an optimum quantity of necessary measurements when building lines areless than 200 m long. Scientific novelty and practical significance: It was defined, that the accuracy of building vector’s designation with a GNSS receiver under different conditions of observations is always higher than the accuracy of coordinate’s designation with the same device; the methodology of bases exploration under different conditions of observation was developed; the optimum quality of necessary measurements on the station in order to provide the given accuracy of results was established; the average square error of line length measurement, which depended on geometry of their location permanent stations.
Key words: GNSS, GNSS-receiver, RTN measurement, coordinates, pseudorange.
Література – 12.
UDC 528.94:004:332.33
L. GEBRYN-BAYDI
Department of Aerospace Geodesy, National Aviation University, 1, Kosmonavta Komarova Ave., Kyiv, Ukraine, 03058,
tel.: 063-338-51-35, е-mail: liliya.gebrinbaydi@gmail.com
APPLICATION OF REMOTE SENSING METHODS TO EVALUATION OF SOIL FERTILITY INDICATORS OF ZAKARPATTIA LANDS
https://doi.org/10.23939/istcgcap2017.01.042
Aim. Identification and evaluation of the soil fertility indicators based on processing of the data of on-ground and remote sensing research on the agricultural lands of different landscape zones in Zakarpattia. Меthodology. The proposed methodology of the laws of physics that describe the relation between the content of humus in soil and spectral energy brightness of soil which is interpreted based on multi-spectral aerospace images, includes three research approaches. The first approach refers to research and identification of statistical linear dependencies of the actual humus level in soil and the spectral energy brightness of soil which was obtained based on processing of the multi-spectral aerospace images. The second approach lies in developing new models that are based on linear dependencies of the actual humus level in soil and the spectral energy brightness of soil and infrared electromagnetic of electromagnetic emission. The third approach is founded on application of degree models that in the best manner describe such dependence. From the point of view of mathematics, importance of the three stages was validated using identification of significance for the correlation coefficients, confidence intervals, mean square deviations of the calculated humus level indicator from the actual humus level indicator, and application of the Fisher coefficient. Findings. In the course of identification and research of statistical linear dependencies of spectral brightness of channels and the relevant humus level indicators in soil it was investigated that the closest inverse linear dependence was detected in the red (Red) spectral channel of the visible range. In application of the second approach, it was revealed that to identify and evaluate the humus level in soil the model which mediates the red and infrared spectral channels based on the relation of the close infrared channel to the red channel, is the most appropriate. As a result of trial of the third approach it was determined that application of power law model includes only the red spectral channel. Scientific novelty. It was stated that using the data on remote sensing of the Earth to identify and evaluate the quantitative indicators of humus level content in soil in the landscape areas of Zakarpattia it is most appropriate to apply the models designed based on the data on spectral energy brightness in the visible and infrared spectral ranges, since the mean square deviation of the estimated humus content level in soil from the actual humus level indicator in these models is minimal, whereas the probability is the highest. Practical significance. This approach enables quick and reliable collection of information on the quantitative indicators of the humus level content in soil for rational managerial decision-making on applicability agrotechnical means to for prevention of soil fertility reduction in relation to landscape zones of Zakarpattia.
ֺKey words: remote sensing of Earth; spectral energy brightness; spectral indices; multi-spectral aerospace images; monitoring of ground layers; humus; linear mathematical models.
Література – 25.
UDK 528.2
L. YANKIV-VITKOVSKA, B. DZHUMAN
Department of Higher Geodesy and Astronomy, Lviv Polytechnic National University, 12, S. Bandera str., Lviv, Ukraine, 79013, ph. +38 (068) 7632139, е-mail teojuman@gmail.com
CONSTRUCTING OF REGIONAL MODEL OF IONOSPHERE PARAMETERS
https://doi.org/10.23939/istcgcap2017.01.027
Aim. The widespread use of global navigation satellite systems (GNSS) has led to the development of new methods designed to determine and accumulate the index of ionosphere ionization (VTEC). Using these data it is possible to significantly improve the accuracy and reliability of determining the coordinates of the observation point. Therefore, the task of constructing a model of ionization index is relevant. Method. To construct a spatial model, we used the spherical Legendre functions of the first kind of real order with integer degree as a basic system of functions. We found the magnitude of order using the Sturm-Liouville theory since it depended on the size of the investigated region. Such system of functions form two orthogonal systems of functions in the region under study (the sphere segment), but does not have recurrence relations between functions, therefore, it is necessary to use function expansion in a hypergeometric series to find them. Also in order to find unknown coefficients of the model it is necessary to use the Tikhonov regularization parameter, since the matrix of normal equations will not be stable. For calculating the time model of the ionosphere the coefficients of different spatial models were expanded in series of power polynomials. Results. Based on the data of the ionization parameter values obtained of 19 permanent stations of the ZAKPOS network using the Trimble Pivot Platform software, the spatial-temporal model of this parameter was constructed using the Legendre spherical functions up to the 3rd order as well as with power polynomials up to 3rd order. The standard deviation between the measured and model values of the VTEC parameter does not exceed 1TECU. The scientific novelty and practical significance. We developed algorithm for construction of the space-time model of the ionosphere parameter. A ionosphere model of high resolution is obtained, which can be used to solve geodetic tasks in order to provide the necessary accuracy in determining the coordinates of the point, as well as to study and forecast the space weather.
Key words: ionosphere parameters, TEC, VTEC, spatial-temporal model, Legendre spherical functions, ionization index, system of functions.
Література – 11.
UDK 692.382
N. BRODSKIY1, P. KONDRATOV2*, A. OGANESYAN2, V. TKACHENKO2
1. The department of architectural designs, Lviv Polytechnic National University, 12, S. Bandera str., Lviv, Ukraine, 79013
2 Research Institute of Design ELVIT, Lviv Polytechnic National University, 5, Knyaz Romana str., Lviv, Ukraine, 79005;
e-mail: kondrpk38@gmail.com
USING INVERSE FILTERING TO INCREASE THE RESOLUTION IR IMAGES
https://doi.org/10.23939/istcgcap2017.01.036
The aim of the work is to increase the resolution of IR images obtained as a result of monitoring thermal objects. Methodology. It is known, an optical system сan not date a CCD point picture thermal object. Instead picture diffraction spots, have significant deterioration in quality thermal image which has a reduced effect with defraction. This is an urgent system task useful in the formative and processing signal. To achieve this goal, it is suggested to use the method of reverse filtration, which allows, knowing the function of point dispersion (FPD) of the optical system caused by the phenomenon of diffraction, to significantly reduce its effect on the quality of the resulting image. In the optics-computer system, the optical image is projected onto a CCD matrix, de FPD which is already presented in digital form. This method based on reverse filtration [Rabiner et al., 1978]. It is believed that blur is an irreversible operation and information is irretrievably lost, because every pixel turns into a spot and everything mixes. Results. In fact, all information is simply redistributed in accordance with the FPD and can be uniquely restored with some reservations. The proposed technique for using the reverse filter algorithm allows us to overcome the limitations imposed by the optical system. Scientific novelty. The authors propose to use the specially developed digital measures and the program of two-convolution convolution (convolution) of these images with FPD to determine the effect of the FPD values on the resolution of the monitoring system. Practical significance. The developed algorithm of reverse filtration (deconvolution) together with other methods (for example, sub-pixel processing) can be successfully used for processing IR images obtained as a result of remote monitoring of thermal objects. The deconvolution method allows overcoming the limitations on the resolution that are imposed by the optical system in the infrared range. This leads, in the absence of noise, to an accurate reproduction of the input image of the thermal object, regardless of the diameter of the world spot. The difference in the values of the FPD optics and the FPD model, which were used in the implementation of convolution and deconvolution programs, is of decisive importance. Especially important are the results of the operation of the method of reverse filtration under the conditions of noise on the thermal image and in the data transmission channel. The value of the signal-to-noise ratio at which the distortions are considered as insignificant is determined. At the same time, as the studies show, the magnitude of the photoluminescence spot of the objective is important. The question of application of the proposed method of reverse filtration in the case of uncertainty of lens data, which was used in thermal monitoring, is often encountered in the practice of processing thermal imagery available to the user. All the results obtained are verified on imitation models, which is the additional novelty and practical significance of the results obtained.
Key words: resolution; lens; the scattering function of a point; model; convolution; deconvolution.
Література – 13.
UDC 332.3: 528.44
YU. HUBAR
The Department of Cadastre of Territory, Lviv Polytechnic National University, 12, S. Bandera str., Lviv, Ukraine, 79013,
Tel. +38 (032) 2582631, e-mail: Yurii.P.Hubar@lpnu.ua
USING TERRAIN LASER SCANNING FOR DETERMINING REAL ESTATE PHYSICAL DETERIORATION
https://doi.org/10.23939/istcgcap2017.01.104
The purpose of the study. The problem of applying terrain laser scanning method (TLS) is current, when it is used to determine real estate and construction physical deterioration of industrial areas and cultural heritage objects. The quality of laser scanning gives the possibility to develop intensively application of TLS for determining building deformation and engineering structures and physical deterioration of their structural components, inside and outside the object. Today the necessity to apply new modern methods has appeared in order to make an objective valuation and thus, to set its market value. Methodology. The methodology is based on the necessity of applying the terrain laser scanning method for determining real estate physical deterioration. While assessing valuating the real estate the main criteria is its physical deterioration for determining building and structure value which is considered as its validity loss and as a result its value loss for any reason [Kharryson H., 1994; Ekkert K., 1997]. The main factors that effect the accuracy and quality of laser scanning are considered to be the accuracy of the device (calibration); scanning conditions (weather conditions); scanning object properties (reflectivity); scanning geometry; previous processing of scanned material (Schultz R., 2010). The results. The importance of terrain laser scanning for calculation of building and structure physical deterioration has been learnt during application. The result has been the basis for the development of a new methodology of real estate valuation. Today the value of building component physical deterioration is determined by visual observation with the help of the simplest devices (plumb, linear, hammer, etc.). The value of physical depreciation of separate structures, and their technical equipment or their parts is determined by comparing of the existing features of physical deterioration with those which have been found during the observation [Kirichek Yu., 2016]. TLS application gives the possibility to set accurately structural parts of the damaged real estate. Scientific innovation. The research has been done based on the possibility of using digital laser scanning for determining the real estate physical deterioration. The necessity of using terrain scanning method in order to improve the methodology of real estate’s valuation and determination its physical depreciation has been stated in the article. This method gives the possibility to avoid appraiser’s subjectivity while calculating, and in accordance with “legal weak-points” of the got results of real estate market value. It has been defined that regulatory methodological documents of real estate physical deterioration are out of date and do not coincide with the real estate market requirements. That is why they need to be improved. Its practical significance. Using TLS for real estate valuation is of a great economic efficiency. It reduces the cost for determining the geometric object characteristics tenfold compared to traditional geodetic methods. Appraisers are recommended in their work to use pulse and phase laser scanners for determining real estate physical deterioration. Terrain laser scanning gives the possibility to get detailed structure of the real estate.
Key words: physical deterioration, terrain laser scanning, valuation, real estate market value, buildings and constructions.
Література – 21.
UDC 332.3
M. TREHUB, I. TREHUB
State Higher Educational Institution “National Mining University”, Dnipro, 19, D. Yavornitskiy av., Ukrainе. EMail: nikolaytregub@gmail.com
CONCEPTS OF RATIONAL LAND USE
https://doi.org/10.23939/istcgcap2017.01.118
Objective. The concept of sustainable land use in the context of sustainable development of land development plays a very important role in modern models of land management. Conditioned by the agrarian orientation of our country, many publications are aimed at solving problems of rational use of agricultural lands, while other categories of land are given less attention. Taking into account the available features for other categories of land, the purpose of this publication is to summarize and to provide conceptual approaches to sustainable land use of industrial areas. Methodology. The results were obtained by analyzing the State legal acts of Ukraine, and from publications of domestic and foreign authors on issues of sustainable development of land and development of eco-cities in Ukraine and abroad. The study is based on official statistics and reports of The State Service of Ukraine for Geodesy, Cartography and Cadastre and State Statistics Service of Ukraine. Results. Based on current research on industrial land use, priority directions of their possible sustainability use were given, and the corresponding specificity was suggested. The concepts of “sustainable development”, “eco-city” and “eco-development” were defined and the results of foreign research on these issues were presented. It was established that in Western Europe, all land management is based on the principles of sustainable development with a significant influence of an environmental component, which is a burning issue in Ukraine as well. Scientific novelty. Scientific novelty is based on the suggestions for a possible adaptation of the environmental component of sustainable use of industrial land to form industrial park land parcels. Practical value. The development of the concept of sustainable territorial development and its adaptation in Ukraine for all categories of land is to become a priority in the near future. In this matter, the most important is the ability to combine the best practices of developed countries, while taking local conditions into account.
Key words: sustainable land use, sustainable development, eco-city, eco-development of industrial parks
Література – 13.
UDC 528.721.287:537.533.35
О. IVANCHUK1, O. TUMSKA2
1 Department of Photogrammetry and Geoinformatics, Lviv Polytechnic National University, 12, S. Bandera str., Lviv, Ukraine, 79013, tel. +38(096)4143409, e-mail: ivanchuk_oleh@ukr.net
2 Department of Photogrammetry and Geoinformatics, Lviv Polytechnic National University, 12, S. Bandera str., Lviv, Ukraine, 79013, tel. +38(050)7455711, e-mail: ol.tums@gmail.com
A STUDY OF FRACTAL AND METRIC PROPERTIES OF IMAGES BASED
ON MEASUREMENTS DATA OF MULTISCALE DIGITAL SEM IMAGES
OF A TEST OBJECT OBTAINED
https://doi.org/10.23939/istcgcap2017.01.053
Purpose. The goal of this work is to establish and study the fractal and metric characteristics of images obtained with scanning electron microscopes (SEM). Methods. This approach is based on the processing of measurements data of digital SEM images of a test object obtained on four types of modern SEM in the magnification range from 1000x to 30000x. Results. The analytical relationship between the increase that was set on the device scale and the “fractal” increase (scale) is established. The similar coefficients Axf (Ayf) and the exponential factors Dxf (Dyf) for fractal magnifications (scales) along the x and y axes are calculated for 4 types of SEM. Formulas are obtained for calculating the possible range magnifications of the images of test object depending the test object spacing, pixel size and scale. The obtained relationships for the calculation of fractal scales allow to automatically determine the real increase (scale) of SEM images and using the calculated coefficients of the polynomials, effectively eliminate their distortions. Scientific novelty. The technique developed by the authors for obtaining fractal and metric characteristics of SEM images was performed for the first time in Ukraine. The proposed methodology is accompanied at all stages by the author's software and demonstrated its effectiveness and expediency. The practical significance. The application of this method of establishing and accounting for the fractal and metric characteristics of digital SEM images makes it possible to more precisely determine the real values of the increases (scales) of digital SEM images and the values of their geometric distortions. Taking into account these characteristics of SEM images makes it possible to significantly improve the accuracy of obtaining spatial quantitative parameters of the micro surfaces of research facilities, and consequently improve their operational and economic characteristics. The obtained characteristics can be additional important quantitative parameters for revealing the features of digital SEM images.
Key words: scanning electron microscope (SEM); the test object; digital SEM image; fractal and metric properties of digital SEM images; real increase (scale), geometric distortion of digital SEM images.
Література – 34.
UDC 630:528.8
О. TOKAR1, M. KOROL2, S. HAVRYLIUK3, A. CUNJAK4
1 Department of International Information, Lviv Polytechnic National University, 12, S. Bandera str., Lviv, Ukraine, 79013,
e-mail: tokarolya@gmail.com
2, 3 Department of Forest Inventory and Management, Ukrainian National Forestry University, 19, Pryrodna str., Lviv, Ukraine, 79057, e-mail: nikkorol@ukr.net, serhiy_havrylyuk@ukr.net
4 Department of Land Management and Design, Ecological College of Lviv National Agricultural University, Zamarstynivska str., 167, Lviv, Ukraine, 79068
APPLICATION OF SATELLITE IMAGES FOR THE ESTIMATION
OF FOREST INVENTORY INDICES
https://doi.org/10.23939/istcgcap2017.01.084
Purpose. Estimation of the state of forest stands using remote sensing data and statistical inventory data and the comparison of forest inventory indices with forest management materials. Methodology. Remote sensing data were used for the investigation of inventory indices. Inventory indices of forest stands of NNP “Skolivsky Beskydy” and ascertain edges of forest massif were done with Landsat ETM+ data (resolution 30 m) and Quick Bird data (resolution 0.6 m). For the image interpretation with the minimal distance algorithm forest stands on sample plots were studied. These sample plots were chosen on the regular network with a pitch of 300 m in QGIS software. Inventory indices estimation was done using common methods in forest management. Results. Utilization of satellite images for forest resources investigation was described. Modern approaches and technologies for forest resources investigation were used. It allowed realizing estimation of edges of forest area for Skole forest district of NNP “Skolivsky Beskydy” (Lviv Region) and specifying edges using remote sensing data. Differences of area on digital maps and forest management materials were calculated. Scientific novelty and practical significance. The algorithm of using remote sensing data for separation of edges of subcompartments was adapted. Obtained results were compared to the forest management database and respective deviations were estimated. These data and the algorithm can be used for creation of digital maps of forest cover, touristic maps, and separation on functional zones.
Key words: forest vegetation; satellite image; image interpretation; raster; digital map.
R. MIELIMĄKA, P. SIKORA
Silesian University of Technology, Gliwice, Poland
PLANNING OF HARD COAL UNDERGROUND MINING OPERATIONS
IN THE ASPECT OF GIS TOOLS
https://doi.org/10.23939/istcgcap2017.01.065
Purpose. This article will discuss the general problems in planning hard coal underground mining operations. The conditions of Upper Silesian Coal Basin perfectly illustrate the complexity of that process. The exemplary concept modern IT Production Management System will be shown. of. The multitude of data contained in the central database allows to take a full advantage of the capabilities of GIS tools that permit fast spatial visualization of the coal deposit and efficiently manage multiple tasks of planning of the mining operations. Methodology. The build-concept of integrated IT Production Management System, which will presented in a very general way, was inspired by results of a detailed inspection of the example of a similar system developed for a mining company in the Upper Silesian Coal Basin in relation to PRINCE2 standards. Results. The benefits of this type of modern solution are particularly evident when planning mining operations in complex, multi-plant mining companies. By taking full advantage of the capabilities of GIS tools it is possible to look at the hard coal deposit from a much wider perspective than with a single mining plant, which improves the rational mining economy. Scientific novelty and practical significance. Presented concept of the build of integrated IT Production Management System allows quickly create multi-variant hard coal deposit development projects, taking into account all the factors that limit the output of the deposit. The system allows the flow of information between dependent business areas and for data to be stored in one place without duplication. The data collected in a central database exemplifies the full advantage of the capabilities of GIS tools in the complex process of planning of production.
Key words: GIS, hard coal mining, planning mining operations, mining deformations.
Література – 13.
УДК 528.3
S. PERIJ, I. POKOTYLO, T. KORLIATOVYCH
Department of Geodesy, of Lviv Polytechnic National University, 12, S. Bandera str., Lviv, Ukraine, 79013,
e-mail: periy_ss@ukr.net, Ivan.Y.Pokotylo@lpnu.ua, tetiasek@gmail.com
INVESTIGATION OF ACCURACY OF METHODS
OF TRIGONOMETRIC LEVELLING DURING THE TRANSMISSION OF ELEVATIONS OVER WATER SURFACES
https://doi.org/10.23939/istcgcap2017.01.018
Aims. The investigations of the transmission of elevations over water surfaces remain topical, so the first aim is to develop the technique of increasing the accuracy of the trigonometric instead of geometrical one. The second aim is to investigate the methods of trigonometric which can be used for the transmission of elevations over water surfaces with the use of modern devices. Methodology. Simultaneous and non-simultaneous reciprocal observations over different water surfaces have been carried out. The results of the trigonometric leveling carried out by different methods have been processed. Results. On the territories of training geodetic site in Berezhany city (Ternopil region) and urban settlement Shatsk (Volyn’ region) the activities directed to the creation of elevation geodetic base have taken place, including the investigations of the accuracy of trigonometric leveling during the transmission of elevation over the water surfaces. Vertical tie-in of geodetic datum has been done by the III class geometrical leveling. For determining heights on the investigated points, linear and angular measurements have been made with the use of automated tachymeters TPS 1201R Leica and TC 2003 Leica. According to the results of the observations on the geodetic site in urban settlement Shatsk, the comparison of the elevations obtained by the geometric leveling and trigonometric leveling by the methods “from inside”, “across the point”, “refraction basis” and non-simultaneous reciprocal leveling has been conducted. Balancing of the analytical network by a method of least squares has been done. According to the results obtained in Berezhany, the coefficients of vertical refraction along different directions have been computed and the comparison of elevations obtained from the III class geometric leveling and from the trigonometric leveling done by the method “from inside” have been conducted. The investigations of the accuracy of different methods of trigonometric leveling compared to III class geometric leveling have shown that they both generally meet the accuracy requirements of leveling on the flat grounds. Since the rough terrain has its peculiarities, some additional measured characteristics of the propagation of the axis of sight over different surfaces should be taken into account, for example, fluctuations of zenith distances determining atmosphere stratification or measured elevations. Scientific novelty. The application of non-simultaneous reciprocal trigonometric leveling over the water surfaces instead the III class geometric leveling on the paths under 1 km in length. Practical applicability. The possibility of replacing the cost-based geometric leveling with the trigonometric leveling without accuracy losses during the transmission of elevations over the water surfaces is shown.
Key words: trigonometric leveling, vertical refraction, geometric leveling, automated electronic tachymeter, refraction basis.
Література – 15.
UDC 629.056.88+551.51
F. ZABLOТSKYI, Ju. GRESKO, B. PALANYTSA
Department “Higher geodesy and astronomy” of Lviv Polytechnic National University, 12, S. Bandera str., Lviv, Ukraine, 79013, e-mail: fzablots@polynet.lviv.ua
MONITORING OF WATER VAPOR CONTENT BY RADIO SOUNDING DATA
AT THE KYIV AEROLOGICAL STATION AND BY GNSS OBSERVATION DATA
AT THE GLSV STATION
https://doi.org/10.23939/istcgcap2017.01.013
The purpose of this paper is determining the water vapor content calculated by the wet component of zenith tropospheric delay (ZTD) obtained by means of radio sounding data and GNSS observations. The investigation methodology is the following: the wet component of ZTD is defined as the difference between the total ZTD derived from GNSS measurements and the calculated hydrostatic component. Then the integrated and precipitable water vapor (PWV) is calculated by means of the wet component. The radio sounding data from Kyiv aerological station as well as the zenith tropospheric delay data from the GLSV GNSS station were processed for six days of each month of 2016. The study results represent the wet component of ZTD and PWV values obtained by the radio sounding data and derived from GNSS observation data. Accuracy evaluation was carried out by the differences between wet component values obtained from the radio sounding data and defined from GNSS measurement data. An analogical accuracy evaluation was made for the PWV values as well. The scientific novelty and practical significance are that the obtained results will serve as the basis for further increasing of determination accuracy of the wet component from GNSS measurements, in particular, to determine its spatial and temporal changes and the PWV content in the atmosphere, which are important for weather forecasting in this region.
Key words: GNSS measurements; radio sounding; zenith tropospheric delay; integrated and precipitable water vapor.
Література – 15.